The Three Global Gas Benchmarks: How Henry Hub, TTF, and JKM Diverged Into Separate Worlds
Henry Hub, TTF, and JKM are supposed to describe one global gas market, but a shortage of liquefaction plants and ships keeps them trading in three different realities.

On August 26, 2022, the Dutch TTF front-month contract settled north of 340 euros per megawatt-hour. Convert that and you are looking at roughly 100 dollars per million British thermal units for gas in Europe. That same week, American gas at the Henry Hub in Erath, Louisiana, was trading in single digits, somewhere around 9 dollars. Same molecule. Same planet. A price gap of more than ten to one. Anyone still describing natural gas as a single global commodity had not looked at a screen in months.
The gas world runs on three regional benchmarks, and they do not agree with one another. Understanding why they can move in opposite directions on the same day is the whole game for anyone trading, hedging, or routing a cargo.
What each benchmark actually measures
Henry Hub is a physical pipeline junction in Erath, Louisiana, where more than a dozen interstate and intrastate lines meet. It is the delivery point for NYMEX natural gas futures, the most liquid gas contract in the world. When you hear a U.S. gas price quoted in dollars per MMBtu, that is almost always Henry Hub. It prices pipeline gas at the wellhead-to-market level, not liquefied gas on a ship. For an American LNG exporter, Henry Hub is the raw feedstock cost before liquefaction adds roughly another 3 to 4 dollars per MMBtu.
TTF, the Title Transfer Facility, is not a physical location at all. It is a virtual trading point covering the Dutch gas grid, traded on ICE Endex and quoted in euros per megawatt-hour. It became Europe's reference price because the Netherlands sat on deep pipeline connectivity and, historically, its own Groningen production. To compare TTF with the dollar benchmarks you convert using roughly 3.412 MMBtu per megawatt-hour, then swap euros for dollars.
JKM, the Japan Korea Marker, is the Asian spot price. S&P Global Platts assesses it by surveying traders, importers, and suppliers each day to estimate what a cargo would fetch delivered into Northeast Asia. Two features matter. First, it is a DES price, meaning delivered ex-ship, so the assessed number already includes the freight to get the cargo to Japan, Korea, Taiwan, or China. Second, it is an assessment, not an exchange settlement. Platts is reading the physical spot market and printing a number, the way an editor sets a benchmark rather than a clearinghouse clearing a trade.
So the three benchmarks are not even the same kind of thing. One is a pipeline futures settlement, one is a virtual-hub futures market, and one is a surveyed spot assessment of gas already loaded onto ships.
The 2022 break
For years these prices tracked loosely, held together by the growing pool of LNG that could, in theory, sail wherever it was worth the most. Russia's invasion of Ukraine in February 2022 shattered that. Most Russian pipeline gas into western Europe stopped, and the continent had to replace it with seaborne LNG almost overnight. European buyers began paying whatever it took.
The result was the spike that put TTF above 340 euros per megawatt-hour in late August 2022, with the highest levels running across five straight trading days from the 22nd to the 26th. Henry Hub, insulated by abundant domestic shale production, never came close. That year the U.S. correlation to Asian prices actually went negative. The United States exported roughly 30 percent more LNG than the prior year and still could not close the gap, because the constraint was not gas in the ground. It was the machinery to move it.
Why the arbitrage does not close the gap
In a textbook, a price gap this wide should snap shut. Cheap American gas would flow to expensive Europe and Asia until the spread collapsed to the cost of transport. It does not happen fast, and the reason is physical, not financial.
Liquefaction is the choke point on the export side. Turning gas into LNG requires enormous, expensive plants that take years to build and run flat out once online. In 2022 the U.S. simply did not have enough liquefaction capacity to send Europe every molecule it wanted. On the import side, Europe lacked the regasification terminals to receive the volumes it was targeting, an increase of tens of millions of tonnes. You cannot arbitrage a price difference if there is no berth to unload at and no train to liquefy at. The spread stays open because the pipe between the two prices is too narrow.
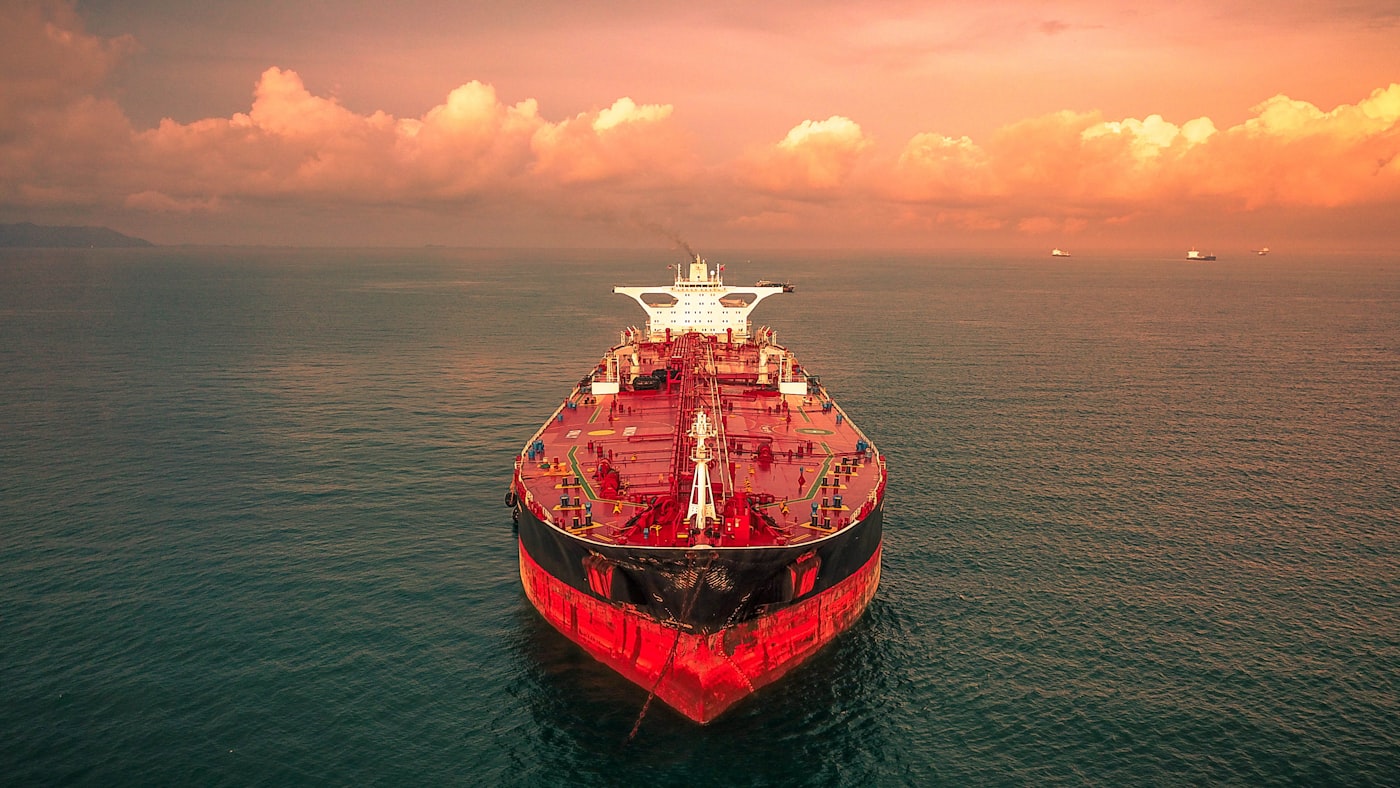
Shipping is the second constraint. The global LNG carrier fleet is finite, charter rates spike when everyone wants a ship at once, and the routes themselves can jam. Congestion at the Panama Canal or the Suez Canal lengthens voyages, burns days of charter cost, and can wipe out a regional price difference that looked profitable when the cargo loaded. A trader does not care about the headline JKM-minus-TTF number. He cares about the netback, the destination price minus feedgas, liquefaction, and freight. When freight blows out, an apparent arbitrage evaporates.
How the spread routes cargoes
What the benchmarks do control is direction. Because JKM already includes delivery to Asia and TTF prices delivery to Europe, the gap between them tells a cargo owner which way to point the ship. The rough rule traders watch is a threshold of a few dollars. When JKM runs above TTF by more than about 3 dollars per MMBtu, flexible cargoes swing east toward Japan, Korea, and China, which drains supply from Europe and pushes TTF up. When TTF sits above JKM, Europe outbids Asia and cargoes divert west.
This is why a heatwave in Japan or a cold snap in Korea can lift European prices even though nothing changed in Europe. The two markets are linked by a single fleet of movable ships bidding against each other for the same molecules. The spread is the signal; the ships are the mechanism; and the amount of gas that can actually reshuffle is capped by how much of it is flexible LNG rather than gas locked into pipelines or long-term contracts.
Three prices, one market, indefinitely
The comforting story is that as more liquefaction comes online through the late 2020s, the three benchmarks converge and the world finally gets one gas price. There is truth in it. More export capacity and more ships mean more molecules chasing the best netback, which pulls the regional prices closer. Recent analysis has noted correlation between the hubs strengthening as LNG stitches the regions together.
But convergence is asymptotic, not absolute. As long as it costs 3 to 4 dollars to liquefy, a dollar or more to ship, and as long as plants and terminals and canals can bottleneck at the worst moment, the three prices will keep their spreads. Henry Hub will stay the cheapest because it never has to leave the pipeline. TTF and JKM will trade a premium that is really the price of a berth, a train, and a boat. The benchmarks diverged into separate worlds because the hardware connecting them is scarce. Build enough hardware and the worlds move closer. They do not become one.
Sources
https://www.spglobal.com/commodityinsights/en/market-insights/blogs/lng/061722-lng-cargoes-diverge-jkm-henry-hub-ttf-ukraine-warhttps://liquefiednaturalgas.org/market/pricing/https://clevermarkets.com/blog/introduction-to-jkm/https://www.esma.europa.eu/sites/default/files/2023-10/ESMA50-524821-2963_TRV_Article_the_August_2022_surge_in_the_price_of_natural_gas_futures.pdfhttps://globallnghub.com/global-gas-price-correlation-strengthens-as-lng-links-regional-markets.htmlhttps://www.ice.com/insights/market-pulse/lng-trading-liquidity-hedging-a-new-landscape-for-natural-gas-benchmarks