Contango vs. Backwardation: Reading the Crude Futures Curve Like a Trader
The slope of the crude forward curve is a price of storage, and learning to read it tells you more about supply, sentiment, and risk than any single spot quote ever will.

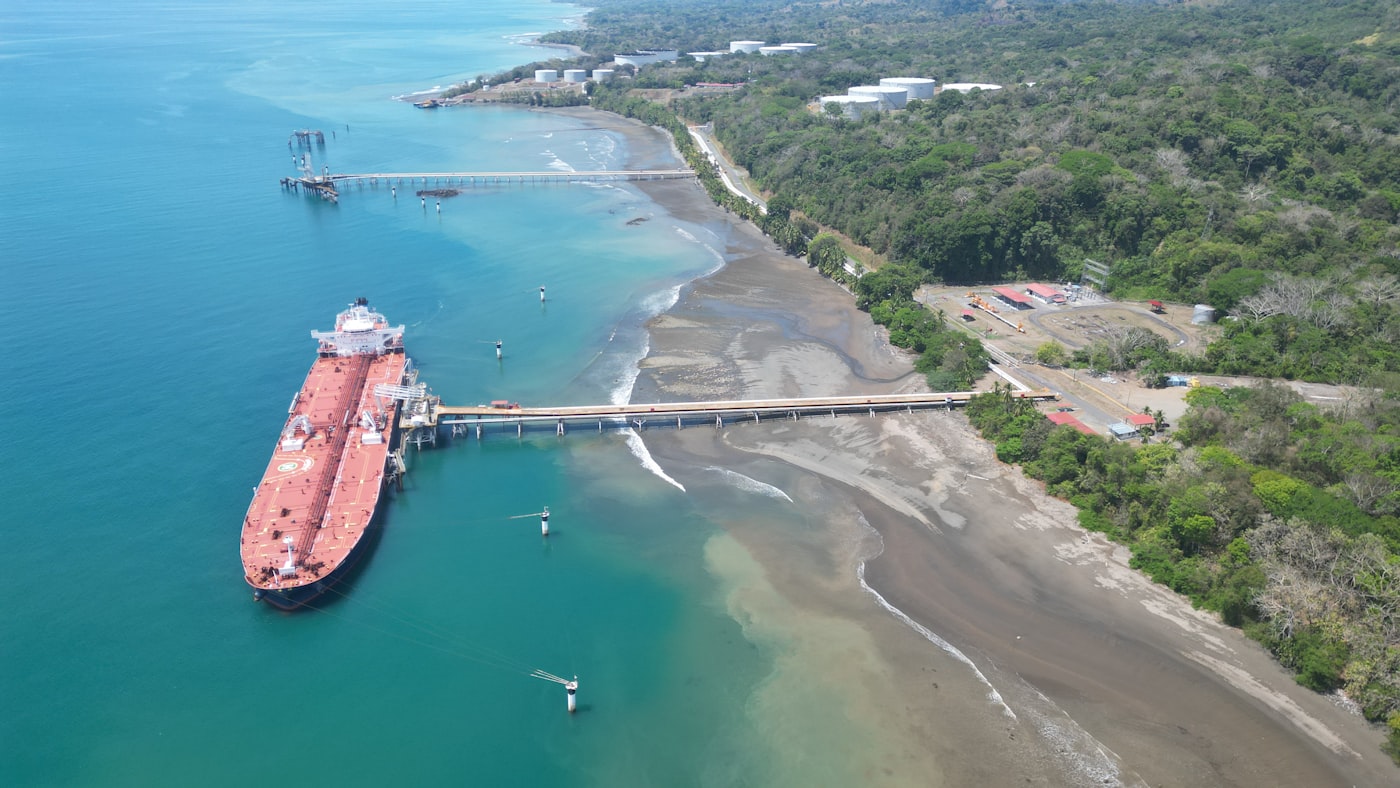
On April 20, 2020, the expiring May WTI contract settled at negative 37.62 dollars a barrel. Traders holding those contracts were, for a few surreal hours, paying other people to haul crude away. It was the first time WTI had gone negative since futures trading began in 1983, and it was not a glitch in the exchange software. It was the forward curve doing exactly what a forward curve is built to do: pricing the cost of holding a physical barrel when nobody has room to hold it. If you want to understand why that day happened, and why it can happen again, you have to stop staring at the spot price and start reading the curve.
Two shapes, one question: what does it cost to wait?
The crude futures curve is just a line connecting the prices of contracts for delivery in successive months. It takes one of two basic shapes. In contango, deferred contracts trade above the front month, so the curve slopes upward. In backwardation, deferred contracts trade below the front month, and the curve slopes down.
Both shapes answer the same question: what is the market willing to pay, or charge, for a barrel you take later instead of now? Crude is storable, so holding it has a cost of carry. That means tank rent, insurance, and the interest you forgo on cash tied up in inventory. When the market is well supplied and the front is cheap, the curve has to rise enough to compensate a holder for those carrying costs. That upward slope is contango, and it is the normal resting state for a non-perishable commodity with a real cost to store.
Backwardation is the opposite signal. When the curve slopes down, the market is paying a premium for a barrel today over a barrel next quarter. Economists call the missing piece the convenience yield: the value of physically having oil on hand when you need it, which in a tight market can exceed storage, insurance, and financing costs combined. A refiner that cannot afford to run dry will pay up for prompt supply. That is why backwardation reads as scarcity and contango reads as glut.
The curve is an arbitrage machine
The shape is not decorative. It sets the economics of the storage trade directly. If the spread between a near contract and a later one is wider than the all-in cost of carry, the trade writes itself: buy physical crude now, sell a forward contract against it, book the barrels into a tank, and lock in the difference. That is a cash-and-carry arbitrage, and it is close to riskless when the storage is secured.
Every trader who puts that trade on tightens the spread. Buying prompt barrels lifts the front, selling the forward pushes down the back, and the curve flattens toward the true marginal cost of storage. In a deep contango, this is why tanks fill and floating storage appears at sea: the curve is literally paying people to warehouse oil. Backwardation runs the machine in reverse. When you are penalized for holding a barrel, inventories get drawn down, tanks empty, and the physical market tightens further. The curve is a control loop, and storage is the throttle.
When the throttle jams: April 2020 at Cushing
That control loop only works if there is somewhere to put the oil. In the spring of 2020, there was not. Demand collapsed as lockdowns spread, refiners cut runs hard, and producers kept pumping into a wall. U.S. refinery inputs fell roughly 20 percent, down to about 13.1 million barrels a day by early May, the lowest since 2008, while crude kept arriving.
All of that surplus rolled toward Cushing, Oklahoma, the physical delivery point for WTI. Between March 13 and May 1, commercial inventories at Cushing rose by 27 million barrels, reaching about 83 percent of the hub's working storage capacity. That headline number understates how bad it was. Much of the remaining physical space had already been leased or committed, so the space actually available to a financial trader who needed to take delivery was far smaller. By April 17, the open interest in the expiring May contract dwarfed the uncommitted capacity left at Cushing by a wide margin.
Here is where curve shape and physical delivery collide. A WTI futures contract is a promise to take physical barrels at Cushing if you hold it to expiry. The May contract expired on April 21. Longs who could not secure storage had two choices: pay someone to accept delivery, or sell before expiry at whatever price cleared. With no tanks and a wall of contracts chasing a sliver of space, the only price that cleared was deeply negative. The curve had been screaming for weeks in a super-contango that made storage worth almost anything. When the storage ran out, the arbitrage that normally caps the spread simply broke, and the front month fell through zero.
Why the curve eats index investors alive
Curve shape is not just a physical-market story. It quietly determines the returns of anyone who owns oil through futures rather than in a tank, which describes most commodity index funds and popular oil ETFs. A fund that tracks crude by holding front-month contracts cannot take delivery, so it must roll: sell the expiring contract and buy the next one before it comes due.
In contango, that roll is a structural loss. The fund sells the cheaper front month and buys the more expensive next month, month after month, selling low and buying high on autopilot. That drag is negative roll yield, and over time it can swamp the underlying price move. The United States Oil Fund, USO, posted a negative annualized return of roughly 14.6 percent over the ten years ending January 31, 2022, even though spot crude was not down anywhere near that much across the span. Persistent contango, not a falling spot price, did most of the damage.
Backwardation flips the sign. When the front trades above the next month, the fund sells high and buys low on every roll, and roll yield turns positive. The lesson for anyone holding a futures-based product: the spot chart is only half the picture. The other half is which way the curve slopes and how steeply, because that spread is being harvested from your position on every single roll.
Reading it live
So watch the shape, not just the number. A widening contango tells you barrels are backing up and storage is getting bid; a deepening backwardation tells you the prompt market is scrambling for supply. When contango stretches toward the physical cost of storage, ask the next question the pros ask, which is whether the tanks can actually hold what the curve is telling them to store. April 2020 was the answer to that question when nobody wanted to hear it. The spot price tells you what a barrel is worth this minute. The curve tells you what the market believes about tomorrow, and where it is quietly making, or losing, its money in between.
Sources
https://www.eia.gov/todayinenergy/detail.php?id=43495https://www.eia.gov/todayinenergy/detail.php?id=46336https://mpra.ub.uni-muenchen.de/112352/1/MPRA_paper_112352.pdfhttps://www.fidelity.com/learning-center/investment-products/etf/commodity-etfs-contango-backwardationhttps://www.vaneck.com/us/en/blogs/natural-resources/understanding-the-components-of-commodity-futures-returns/https://www.cmegroup.com/insights/economic-research/2026/implications-of-wti-oil-futures-in-backwardation-amid-the-supply-crunch.html