Crude Oil Forecast Q3 2024
At the start of 2024, forecasts predicted Brent crude oil would trade above $90 per barrel in the second half of the year. Oil prices have indeed surpassed this level several times already, and analysts still expect them to briefly rise above it in the third quarter. However, any rally is unlikely to be sustained.
Considering anticipated global monetary policy developments, a rebound in demand appears improbable. Oil prices have shown remarkable resilience despite the disappointment from the revaluation of potential interest rate declines in the U.S. and globally. Markets had anticipated several rate cuts by early 2024, but inflation, although moving in the right direction, has not subsided as expected. By the end of the year, investors will likely be relieved if the Federal Reserve only makes one rate cut.
Lower rates typically encourage economic activity, increasing energy demand. Therefore, the expectation of prolonged higher rates will likely continue to weigh on petroleum prices. Like all markets, oil prices will remain sensitive to inflation figures from key industrialized nations, particularly the United States.
OPEC+ Policy Remains Key for Oil Outlook
Meanwhile, the Organization of Petroleum Exporting Countries and its allies, known as OPEC+ (including Russia), are trying to balance significant production cuts to support prices with the desires of allies like the United Arab Emirates to pump more oil.
Most of the cuts will extend until 2025 under a complex agreement reached in June, but the "voluntary" component will start to phase out in October. For example, Saudi Arabia might increase its daily output from nine million to ten million barrels by the end of next year. Though this is an increase, it is small compared to the country's potential production capacity of around twelve million barrels.
The International Energy Agency (IEA) notes that OPEC+ now represents a lower share of world supply than since its founding in 2016. By the end of this decade, the group anticipates an oil glut that is "staggering" compared to demand, a process it claims is already underway.
Global Conflicts Impacting Oil Prices
Unfortunately, ongoing conflicts in the Middle East and Ukraine will likely continue to support oil prices this quarter. Long-lasting truces between Moscow and Kyiv, as well as between Israel and Hamas, remain elusive.
The U.S. benchmark for oil prices has mostly fluctuated between $76 and $84. This broad range may persist over the next three months unless there is clear evidence that lower interest rates could occur sooner than markets currently anticipate.
Oil Inventories Forecast
Global observed inventories increased in May for the fourth consecutive month, reaching their highest level since August 2021. Offshore inventories moved ashore rapidly, reducing oil on water while on-land stocks rose to a 30-month high ahead of the seasonal refinery activity increase. OECD industry stocks built for the second consecutive month after declining for the previous six months. Preliminary data suggests global oil stocks fell by 18.1 million barrels in June, led by a 1 million barrel per day draw in crude.
The EIA forecasts that OPEC+ will produce less crude oil than the group’s announced targets through the rest of the forecast period, reducing global oil inventories through mid-2025 and keeping OECD inventories near the bottom of the range. Global oil inventories decreased by an estimated 0.6 million barrels per day in 2Q24, and the agency expects they will decrease by 0.8 million barrels per day on average from 3Q24 through 1Q25.
The EIA anticipates a gradual return to moderate inventory builds in 2025 after the expiration of voluntary OPEC+ supply cuts in 4Q24 and after forecasted supply growth from countries outside of OPEC+ begins to offset global oil demand growth. Beginning in 3Q25, they estimate global oil inventories will increase by an average of 0.3 million barrels per day, and by 0.4 million barrels per day in 4Q25.
Although the recent attacks have not yet directly decreased the oil supply, the possibility of further escalation and the lack of a resolution surrounding the Red Sea attacks have added higher shipping costs and an ongoing risk premium to oil prices in the near term. Increased tensions in the Middle East and Houthi attacks on shipping vessels around the Red Sea, which have largely cut off the shipping channel for many oil shipments, continue to add uncertainty.
Global Oil Demand Forecast 2024
In 2Q24, global oil demand growth dropped to just 710,000 barrels per day, the lowest quarterly increase in more than a year. Long the main driver of rising global oil demand, China’s oil consumption fell in both April and May and is currently estimated to have slightly decreased from year-ago levels in 2Q24. This is a stark contrast to the yearly growth of 1.5 million barrels per day in 2023 and 740,000 barrels per day in 1Q24, with especially lower demand for petrochemical feedstocks and industrial fuels.
The EIA forecasts that global consumption of liquid fuels will increase by 1.1 million barrels per day in 2024 and 1.8 million barrels per day in 2025. Most of the expected demand growth is from non-OECD countries. In 2024, non-OECD liquid fuel consumption increases by 1.2 million barrels per day, offsetting a small decline in OECD consumption, particularly in Europe and Japan. In 2025, non-OECD consumption rises by 1.4 million barrels per day, mostly in China, where EIA expects consumption to increase by 0.4 million barrels per day, and India, with a 0.3 million barrel per day increase. They forecast OECD consumption rises by 0.4 million barrels per day, led by growth in the United States.
Global Oil Supply Forecast 2024
Global oil supply trended higher, with 2Q24 production up 910,000 barrels per day from 1Q24, led by the United States. Output is forecast to rise by another 770,000 barrels per day in 3Q24, with non-OPEC+ providing 600,000 barrels per day of the gains. For 2024, global oil supply growth is forecast to average 770,000 barrels per day, boosting oil supply to a record 103 million barrels per day.
The IEA expects non-OPEC+ output to rise by 1.5 million barrels per day, while OPEC+ production will fall by 740,000 barrels per day year-on-year if existing voluntary cuts are maintained. Global supply growth in 2025 is projected to be much stronger at 1.8 million barrels per day, with non-OPEC+, mainly the United States, Canada, Guyana, and Brazil, leading gains for a third consecutive year, adding 1.5 million barrels per day.
The EIA forecasts that global production of petroleum and other liquid fuels will increase by 0.6 million barrels per day in 2024. They expect OPEC+ liquid fuels production to decrease by 1.3 million barrels per day in 2024, while production outside of OPEC+ increases by 1.9 million barrels per day, led by growth in the United States, Canada, Guyana, and Brazil.
The agency expects global production of liquid fuels to increase by 2.2 million barrels per day in 2025, as the OPEC+ voluntary production cuts unwind throughout the year. OPEC+ production will increase by 0.7 million barrels per day, combined with 1.4 million barrels per day of production growth from countries outside of OPEC+ in 2025.
Technical Oil Prices Forecast Q3 2024
Narrowing price action may keep oil within a tighter range in Q3, according to the latest Brent and crude oil technical analysis and forecasts.
Both WTI and Brent show a triangle pattern, a consolidation chart pattern that occurs mid-trend and usually signals a continuation of the existing trend. The triangle pattern is formed by drawing two converging trend-lines as the price temporarily moves sideways.
These patterns can serve as reversal or continuation patterns. What they share in common is that the price range converges into a narrower range until it breaks out either in the direction of the trend (continuation) or in the opposite direction (reversal). The price action needs to move in a series of lower highs and higher lows to define a triangle.
The U.S. benchmark has reached five-month highs at the beginning of Q4 2023, the widest point of the triangle.
A triangle pattern is generally considered to be forming when it includes at least five touches of support and resistance; three touches for one of these lines and two for the other.
Along with cup and handle, head and shoulders, double/triple top and bottom, rising and falling wedges, flags, and pennants, triangles are among the most widely followed Western chart patterns. As with Japanese candlestick patterns, understanding the logic behind these patterns makes them easier to remember.
Oil Brands
When discussing the commodity oil traded on financial markets, there are two main types to distinguish. The most popular and widely traded is American oil, known as WTI. The other well-known variant is Brent.
West Texas Intermediate (WTI)
West Texas Intermediate (WTI) is a light sweet crude oil that is extensively used in US refineries and serves as a crucial benchmark for oil prices. WTI is characterized by its high API gravity and low sulfur content, which determine its density relative to water. WTI oil is actively traded by oil companies and investors, primarily through futures contracts on the CME Group. The Light Sweet Crude Oil (CL) future is among the most traded futures globally.
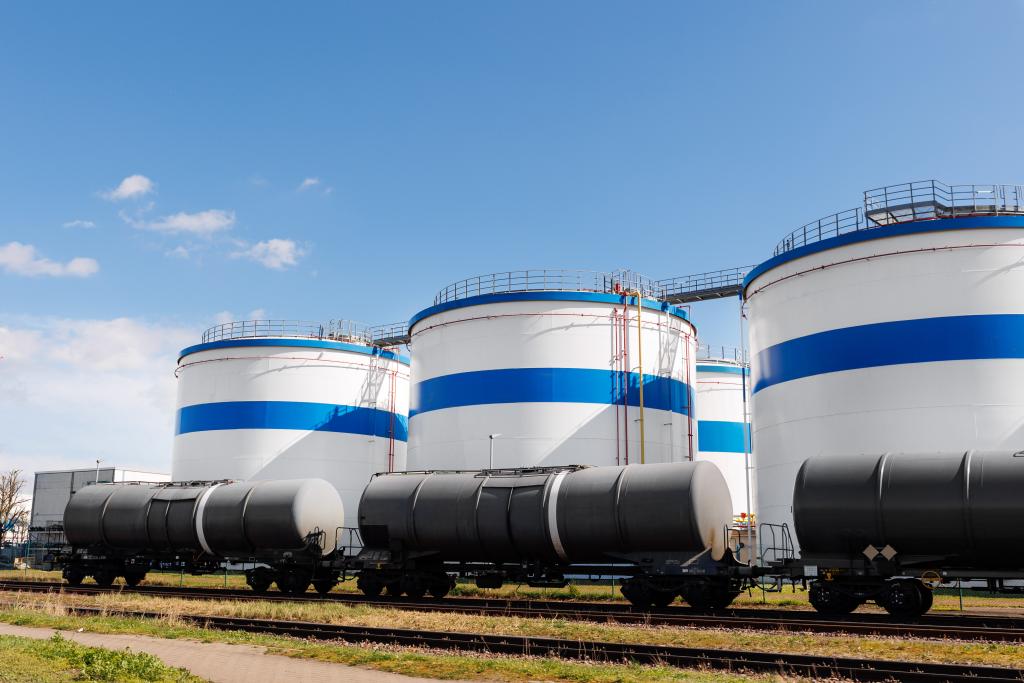
Most WTI oil is stored in Cushing, Oklahoma, a key hub for the oil industry, featuring large storage tanks connected to pipelines that distribute oil throughout the United States. WTI is a vital feedstock for refineries in the Midwestern United States and along the Gulf Coast.
Brent Crude Oil
Brent oil serves as an important benchmark for oil prices, particularly in Europe, Africa, and the Middle East. Its name comes from the Brent oil field in the North Sea, which was once one of the most productive oil fields in the UK, operated by Royal Dutch Shell. Although many of the platforms there have been decommissioned, Brent remains a key reference in the oil market.
The price movements of WTI and Brent futures are highly correlated. However, there have been instances in recent years where Brent prices exceeded WTI prices by more than $10. At the end of 2020, the price difference was about $3. These variations are influenced by factors such as supply and demand dynamics, as well as the costs associated with shipping and storing oil.
 Español


